
Measuring Incentive ROI


Attribution, Impact & Continuous Improvement
2026 Incentive Strategy Roadmap | Mile 9
As we move into the ninth mile of our 2026 Incentive Strategy Roadmap, one theme continues to connect every article in this series: successful incentive programs are built with intention, measured with discipline, and improved through data.
From establishing innovation baselines and North Star metrics to modernizing rebates, personalization, digital disbursements, participant experience, compliance, and channel incentives, each topic has reinforced the same reality. Incentive programs are no longer simple reward mechanisms. They have become strategic business tools that influence behavior, strengthen relationships, and drive measurable outcomes.
If you've missed any articles in the series so far, you can explore the complete collection through the 2026 Incentive Strategy Roadmap hub on GroupO.com.
This month, we tackle one of the most important and frequently discussed topics in incentive marketing:
How do you know if your incentive program is actually working?
Executives are increasingly asking incentive teams to justify program investments through measurable business outcomes. Participation rates and reward redemption statistics may tell part of the story, but they rarely tell the whole story.
The most meaningful insights often come directly from customers themselves through survey feedback, social conversations, support interactions, online reviews, and other moments where they openly share their experiences and perceptions. These voices provide critical context that metrics alone cannot capture.
True ROI requires understanding attribution, measuring behavior change, connecting incentive activity to business results, and incorporating customer sentiment to determine whether a program is influencing not only what customers do, but also how they feel about your brand.
In 2027 and beyond, organizations that can clearly demonstrate program impact will be far better positioned to secure budget, optimize performance, and grow strategically.
Why Incentive ROI Matters More Than Ever
Incentive programs compete for investment alongside virtually every other business initiative.
Marketing teams must justify campaign spend.
Operations teams must justify technology investments.
Sales organizations must justify enablement efforts.
Incentive programs are no different.
The challenge is that incentive ROI isn't always obvious.
An increase in sales, retention, product adoption, participation, or loyalty may be influenced by multiple factors occurring simultaneously. Advertising campaigns, product launches, pricing changes, economic conditions, and market shifts all impact performance. At the same time, customers' perceptions of a brand, the quality of their experiences, and their willingness to advocate for or remain loyal to an organization can be shaped by factors that traditional program metrics do not capture.
That's why leading organizations have moved beyond simply reporting activity metrics and now focus on measuring incremental business impact. Increasingly, they are also incorporating customer feedback, sentiment analysis, satisfaction measures, and voice-of-customer data to better understand not only what behaviors changed, but why those behaviors changed.
According to research published by the Incentive Research Foundation (IRF), one of the greatest challenges in incentive measurement is establishing causality and separating the impact of a program from other market influences. The organization highlights the importance of control groups, outcome-based measurement, and disciplined attribution practices.
While attribution remains essential, organizations are discovering that customer sentiment can provide an additional layer of insight. Survey responses, online reviews, social media conversations, customer support interactions, and other direct feedback channels often reveal how incentive programs influence customer perceptions, strengthen emotional connections, and contribute to long-term loyalty that may not be immediately visible in transactional data alone.
The question is no longer:
"How many people participated?"
The question is:
"What changed because they participated?"
And increasingly, organizations are asking a complementary question:
"How did the experience influence what customers think and feel about our brand?"
Understanding Attribution: Connecting Actions to Results
One of the biggest mistakes organizations make is assuming correlation equals causation.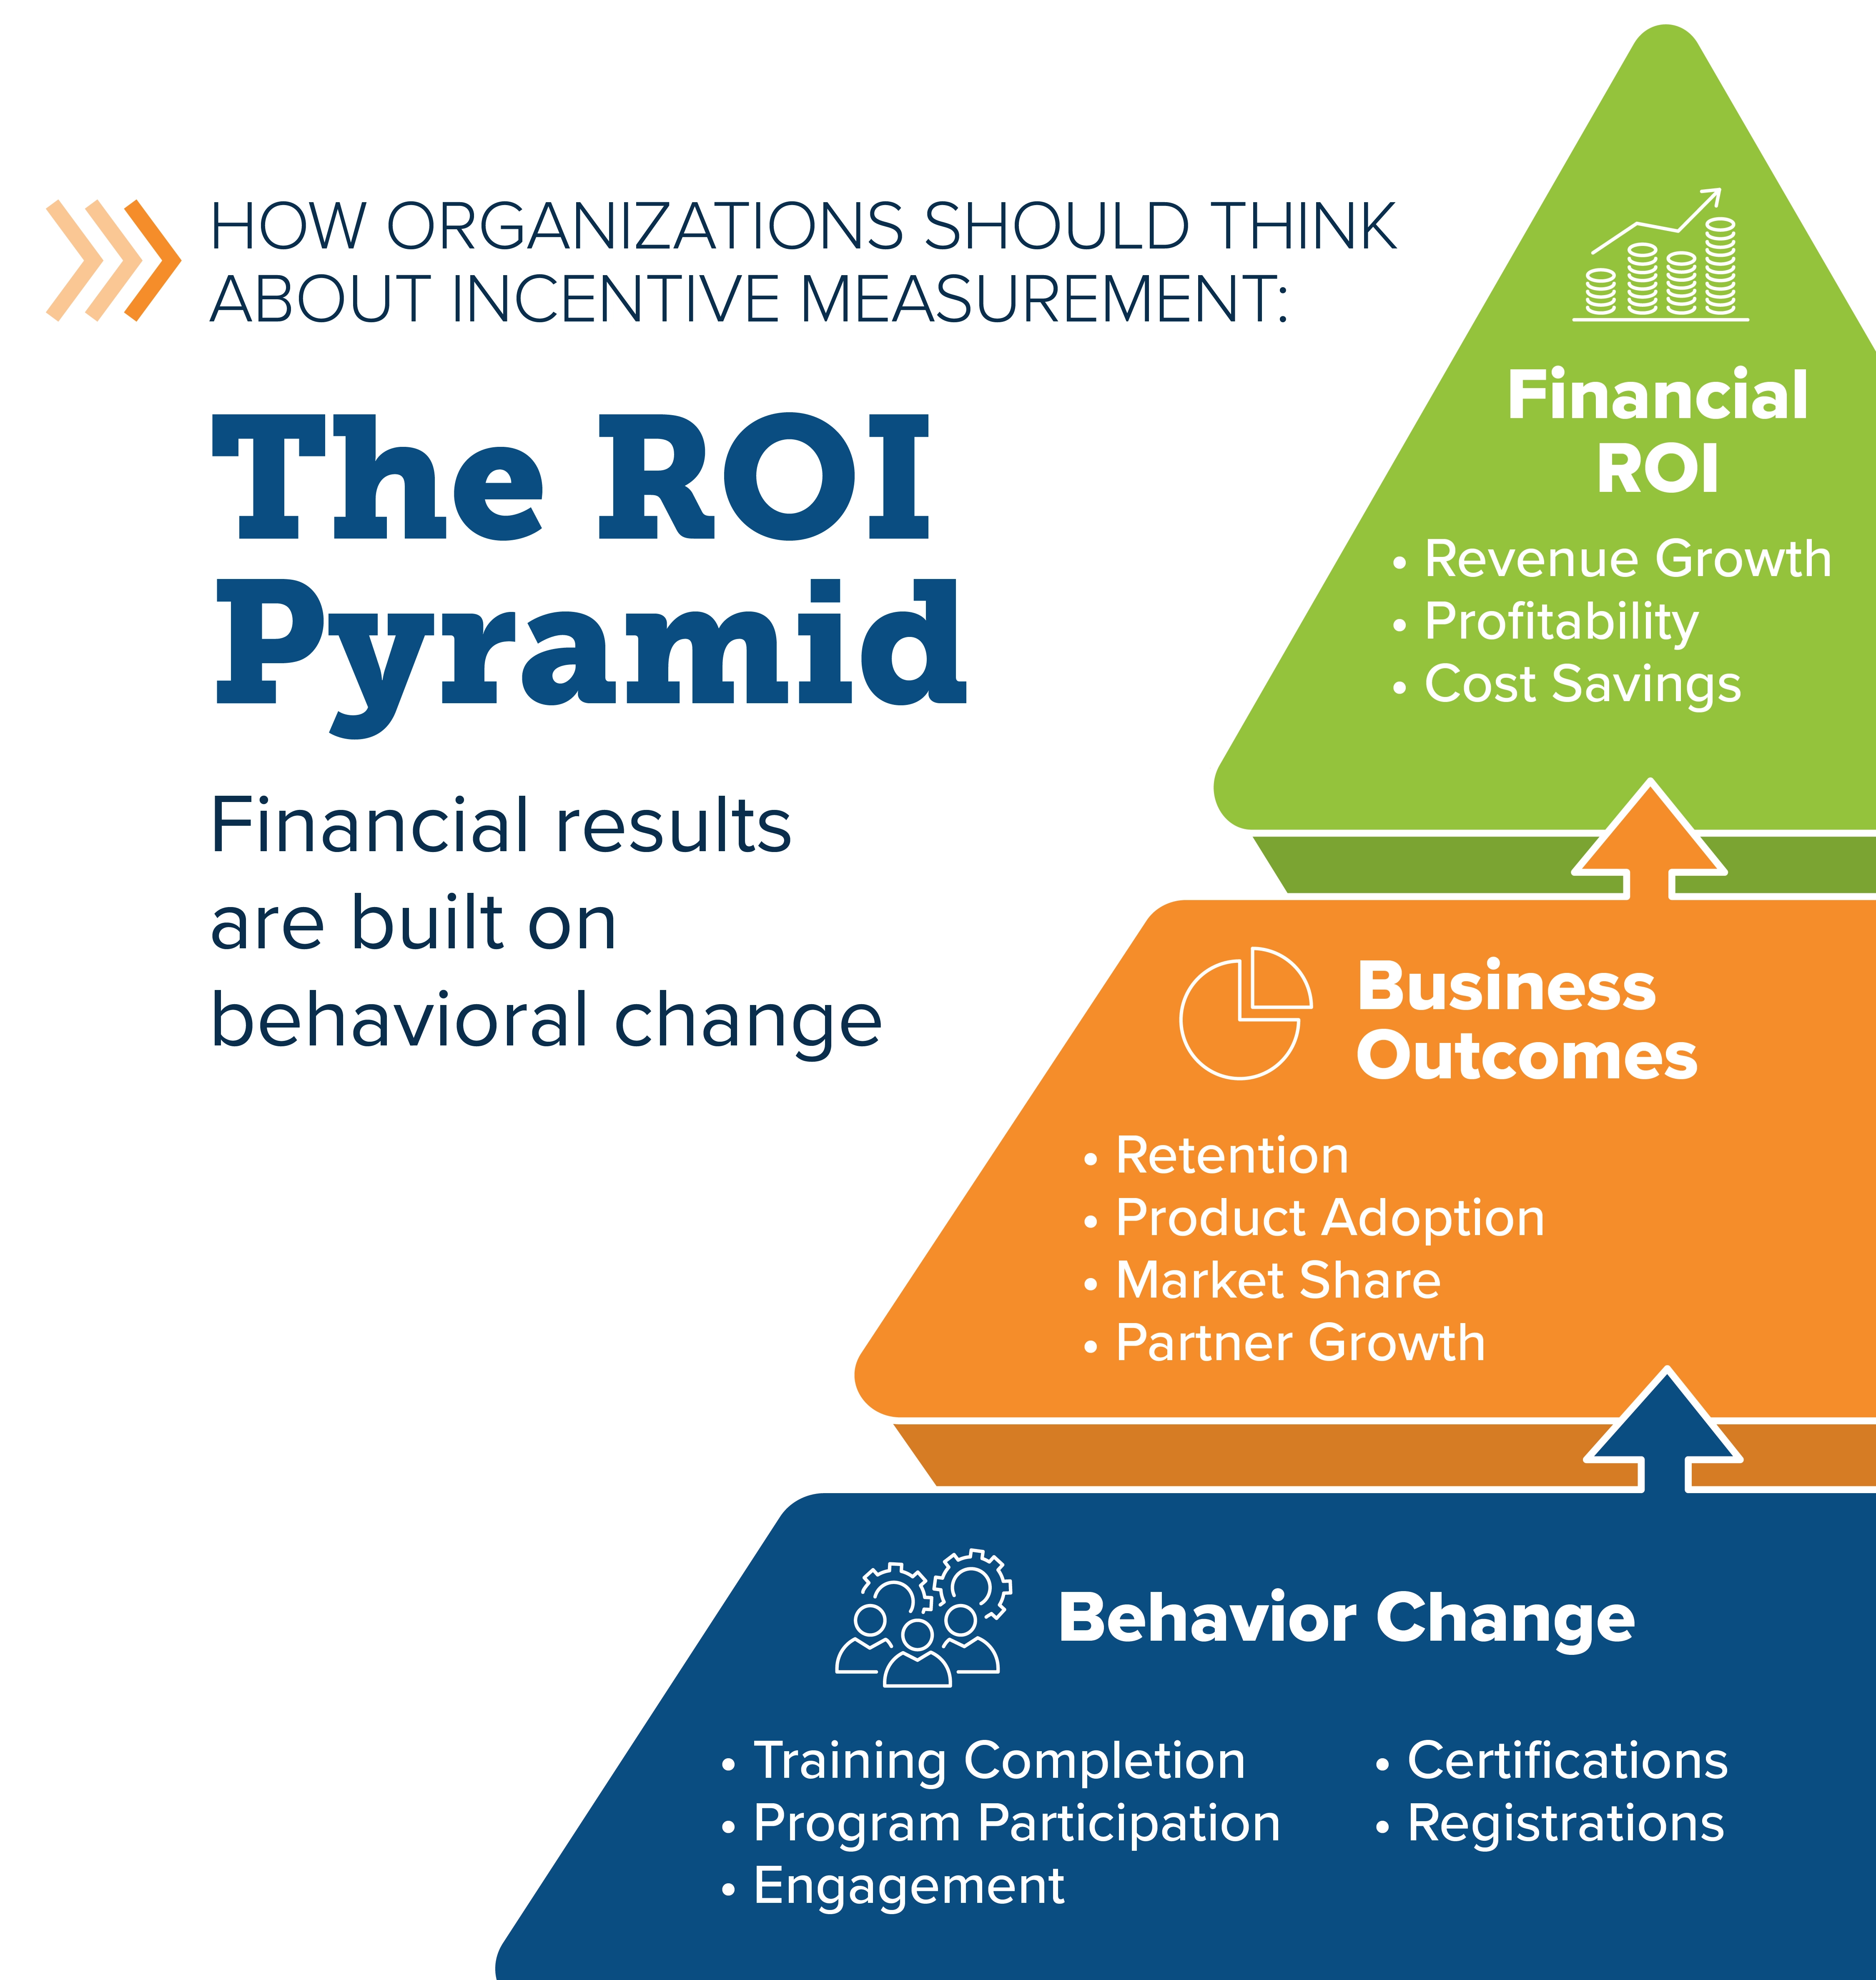
Just because sales increased during an incentive program doesn't mean the incentive alone caused the increase.
Strong ROI analysis begins with attribution.
Attribution is the process of identifying which actions, communications, rewards, or participant behaviors contributed to a measurable outcome.
Organizations should seek answers to questions such as:
• Did participants outperform non-participants?
• Did certified partners generate more revenue than uncertified partners?
• Did enrolled customers demonstrate higher retention rates?
• Did specific rewards improve participation more effectively than others?
• Which communications generated the highest engagement?
The goal is to move beyond assumptions and toward data-supported decisions.
The Incentive Research Foundation specifically identifies matched comparison groups, historical baseline analysis, and outcome-based measurement as valuable approaches for understanding true program influence.
At the same time, organizations should recognize that business results rarely occur in isolation. Behavioral changes often emerge first, followed by measurable business outcomes, and ultimately financial impact. Customer attitudes and experiences frequently play a significant role at each stage of that progression.
The ROI Pyramid illustrates this relationship. At its foundation are the behavior changes incentive programs are designed to encourage, such as training completion, program participation, engagement, certifications, and registrations. Those behaviors contribute to broader business outcomes such as retention, product adoption, market share growth, and partner development. Financial ROI, including revenue growth, profitability, and cost savings, sits at the top of the pyramid because it is ultimately built upon the success of the layers beneath it.
Organizations are increasingly adding customer experience and sentiment measures throughout this framework. Customer satisfaction scores, Net Promoter Scores (NPS), survey feedback, online reviews, support interactions, and social sentiment can help explain whether incentive-driven behaviors are strengthening customer relationships and improving perceptions of the brand. In many cases, positive shifts in sentiment emerge before corresponding improvements become visible in retention, loyalty, or revenue metrics.
When viewed through this lens, attribution becomes more than connecting incentives to financial outcomes. It becomes the process of understanding how incentives influence behaviors, how those behaviors shape customer experiences, and how those experiences ultimately contribute to measurable business performance.
Looking Beyond Revenue
Revenue matters. But revenue alone rarely tells the complete story.
Many incentive programs create value in other ways, including:
• Increased retention
• Higher participation rates
• Improved customer satisfaction
• Stronger partner engagement
• Faster product adoption
• Training completion
• Reduced support costs
• Lower customer acquisition expenses
• Improved participant experience
A customer incentive program that drives stronger retention may generate substantial long-term value even if immediate revenue gains appear modest.
Similarly, a channel incentive program that increases technical certifications may strengthen future pipeline performance without creating an immediate sales spike.
Customer sentiment can provide an additional layer of visibility into these outcomes. Feedback collected through surveys, loyalty studies, reviews, customer service interactions, and digital listening channels can help organizations understand whether participants found the experience meaningful, motivating, and worthy of continued engagement. These insights often reveal emerging risks and opportunities long before they appear in financial reports.
The most mature organizations measure both leading and lagging indicators.
Leading indicators reveal whether desired behaviors are occurring.
These indicators may include participation levels, training completions, engagement rates, certification attainment, customer satisfaction scores, and sentiment trends.
Lagging indicators reveal whether those behaviors ultimately influenced business outcomes.
These indicators may include retention improvements, increased revenue, greater market share, higher profitability, reduced costs, and long-term customer loyalty.
How Group O Approaches ROI Measurement
At Group O, we believe measurement should be incorporated into program design from the very beginning, not added after launch.
This philosophy traces back to our earlier discussion on North Star Metrics and KPI planning. Programs should be designed around measurable business objectives before rewards are ever issued. Where appropriate, organizations should also consider how they will measure customer perceptions and experiences that may influence long-term program success.
Our reporting approach generally focuses on four areas:
1. Define Success Before Launch: Every program needs a clear objective.
Examples may include:
• Increasing customer acquisition
• Improving retention
• Driving channel engagement
• Increasing product adoption
• Encouraging desired participant behaviors
• Reducing program friction
Without clearly defined objectives, meaningful ROI measurement becomes difficult. Organizations should also identify any customer experience or sentiment metrics that support these objectives, allowing them to understand both behavioral and perception-based outcomes.
2. Establish Baseline Performance: Before evaluating results, organizations need a reliable baseline.
This may include:
• Historical sales performance
• Existing participation rates
• Current retention levels
• Previous customer acquisition costs
• Program engagement benchmarks
The baseline becomes the reference point against which future performance is evaluated.
3. Capture Performance Data Continuously: Group O supports ongoing measurement through analytics dashboards, performance reporting, and real-time program visibility. Our reporting environments can include offer-level performance, financial metrics, demographics, participation insights, denial reasons, and executive-level reporting views. Customer feedback and experience indicators can also provide valuable context for understanding participant reactions and emerging trends.
Rather than waiting for program completion, organizations can identify trends as they emerge and make adjustments throughout the program lifecycle.
4. Turn Reporting into Optimization: Data should not simply explain what happened.
It should help determine what happens next.
Group O emphasizes continuous improvement through performance tracking, behavioral insights, predictive analysis, trend identification, and executive dashboards that support program refinement over time. When available, customer sentiment and feedback can help explain why specific behaviors are occurring and identify opportunities to improve program design, communications, and participant experiences.
The highest-performing programs are rarely "set it and forget it" initiatives. They continuously evolve based on data.
Three Real-World ROI Lessons
 A leading consumer products manufacturer partnered with Group O to modernize its rebate program after struggling with slow processing times, limited reporting visibility, and growing fraud concerns. The goal was not only to improve the customer experience but also to gain better insights into program performance and return on investment.
Over the first 2.5 years, the program processed more than 1 million rebate claims and distributed over $9 million in rewards. Data revealed a significant shift in consumer behavior, with mail-in submissions dropping from 37% to just 6% of total claims as customers embraced a faster digital redemption experience. This transition reduced processing costs while improving the customer experience through online claim validation completed in just 2 to 3 days compared to several weeks previously.
The client's reporting environment, powered by Power BI dashboards and self-service analytics, provided ongoing visibility into participation trends, payment preferences, fraud activity, and consumer engagement. Insights from the data enabled continuous program refinement, including enhancements to fraud detection that identified suspicious activity, blocked fraudulent claims, and saved more than $200,000 in reward costs. Reporting also highlighted strong engagement, with more than 132,000 registered users and over half submitting multiple rebates, demonstrating sustained program value beyond a single transaction.
Perhaps most importantly, the data helped the client move beyond managing rebates as a tactical promotion and begin using program intelligence to guide future decisions. Improved visibility into performance, customer behavior, and operational efficiency contributed to lower complaint volumes, higher stakeholder satisfaction, and the expansion of additional programs onto the platform. The result was a rebate program that continuously improved over time while delivering measurable financial and operational returns.
Key Results:
• 1M+ rebate claims processed
• $9M+ in rewards fulfilled
• Mail-in submissions reduced from 37% to 6%
• Online validation improved from 2-3 weeks to 2-3 days
• 132,000+ registered users
• 51% of registered users submitted multiple rebates
• $200K+ in prevented fraud costs
• Significantly reduced customer complaints and escalations
This example reinforces a core principle of ROI measurement: the most valuable programs don't just generate participation, they generate the data needed to continuously improve performance, reduce waste, and make smarter business decisions.
 A large utility provider sought to create a customer rewards program that would support acquisition, retention, and long-term engagement while providing flexibility in how customers redeemed and used their rewards. As the program expanded across multiple offers, customer segments, and communication channels, leadership needed better visibility into program performance and a deeper understanding of how rewards influenced customer behavior after approval.
To support these objectives, the organization implemented comprehensive reporting that tracked participation, reward approvals, customer engagement, communication effectiveness, redemption behavior, and post-reward card spending. By analyzing these metrics together, the program team gained a more complete view of customer value and program ROI than approval rates alone could provide.
Since launch, the program has processed more than 1 million customer submissions, resulting in over 416,000 approved rewards and approximately $52 million in value returned to customers. A multi-channel engagement strategy, including direct mail, SMS, email, online tools, IVR, and customer service support, helped keep rewards visible and accessible throughout the customer journey. Reporting identified which communication channels generated the strongest engagement, enabling continuous refinement of outreach efforts and improving overall reward utilization.
Perhaps the most valuable insight came from post-approval spending analytics. Rather than measuring success only by reward distribution, the program tracked how customers used their rewards after redemption. The data revealed that customers actively used reward funds across everyday spending categories, including groceries, retail purchases, fuel, restaurants, and utilities. In fact, more than $200,000 of reward value was spent directly with the utility provider during the first half of the year, demonstrating that the program not only delivered value to customers but also helped strengthen the ongoing customer relationship.
These insights transformed reporting from a transactional measurement tool into a strategic decision-making resource. By understanding customer engagement before and after reward approval, program leaders were able to optimize communications, improve redemption rates, increase reward utilization, and better demonstrate the long-term value generated by the program.
Key Results:
• 1M+ customer submissions processed
• 416,000+ rewards approved
• $52M+ in reward value distributed
• 331,000+ reward cards issued
• 58,000+ reward card transactions in the first half of the year
• $2M+ in reward card spend tracked
• 19,000+ SMS reminders delivered
• 73,000+ customer postcards distributed
• Nearly 60% of card spend occurred in retail and grocery categories
• More than $200,000 spent directly with the utility provider
This example highlights an important principle of ROI measurement: the most successful incentive programs are not evaluated solely on participation or approvals. By combining engagement reporting, communication analytics, and post-reward spending insights, organizations can better understand customer behavior, strengthen relationships, and demonstrate the full business value of their incentive investments.
 A telecommunications provider partnered with Group O to manage and optimize a rapidly expanding customer rewards program during a period of significant business growth and platform transition. As participation increased, the organization needed greater visibility into redemption activity, customer engagement, fulfillment performance, and operational scalability to ensure a positive customer experience while supporting new promotional initiatives.
Using a combination of automated reporting, Power BI dashboards, and operational analytics, the program team monitored redemption trends, customer engagement, inventory levels, fulfillment activity, and data quality metrics. These insights provided leadership with a clear view of program performance and helped identify opportunities to improve customer experiences, streamline operations, and support continued growth.
As the program expanded, redemptions grew from approximately 5,700 to more than 36,000 while maintaining strong customer engagement. Reporting data revealed participation patterns, redemption behaviors, and inventory requirements that enabled proactive planning and successful support of large-scale customer imports. Analytics also helped optimize fulfillment readiness, reduce operational risk, and ensure reward availability as customer demand accelerated.
Customer engagement insights played an equally important role. With email open rates reaching 72%, the program team gained valuable visibility into how customers interacted with promotional communications and reward offers. These insights informed future campaign strategies and supported the successful introduction of new reward options and promotional campaigns, including digital rewards and partner-sponsored offers.
Perhaps the most valuable outcome was the ability to transform reporting from a scorekeeping tool into a strategic decision-making resource. By providing ongoing visibility into customer behavior, redemption activity, and operational performance, the program created a foundation for continuous improvement and scalable growth. The result was a rewards program that not only increased participation, but also delivered the insights needed to improve future promotions, strengthen customer engagement, and maximize program ROI.
Key Results:
• Scaled redemptions from approximately 5,700 to more than 36,000
• Supported large-scale customer imports and program expansion
• Achieved a 72% email open rate, demonstrating strong customer engagement
• Improved reporting visibility through automated dashboards and analytics
• Enhanced inventory planning and fulfillment readiness
• Expanded promotional offerings with new reward types and partner campaigns
• Reduced operational risk while supporting a major platform transition
• Enabled data-driven decisions that supported continued program growth
This example illustrates how the true value of program data goes beyond measuring participation. When organizations have visibility into customer behavior, engagement trends, and operational performance, they can make smarter decisions, improve scalability, and continuously optimize program outcomes to generate greater long-term ROI.
Using Data to Drive Continuous Improvement
Data is only valuable when organizations act upon it. Leading incentive teams continuously evaluate:
• Which rewards drive the highest participation?
• Which communications generate engagement?
• Which participant groups are underperforming?
• Where friction exists in the customer journey?
• Which channels produce the strongest outcomes?
• Which behaviors correlate with success?
This creates a cycle of continuous improvement:
Measure → Analyze → Optimize → Measure Again
Organizations that embrace this cycle consistently achieve stronger program performance than those that simply review results after completion.
Key Terms for This Article
Attribution: The process of determining which activities or program components contributed to a measurable business outcome.
Incremental Impact: The additional value generated by a program beyond what would have occurred naturally without the incentive.
KPI (Key Performance Indicator): A measurable metric used to evaluate progress toward a specific business objective.
Control Group: A comparison audience that does not participate in a program and is used to help isolate program impact.
Outcome-Based Measurement: An evaluation methodology focused on business results and behavioral changes rather than activity metrics alone.
Uplift Analysis: A measurement approach used to determine how much improvement can be attributed to a program versus expected baseline performance.
Executive Reporting: Strategic reporting designed to communicate performance, ROI, risks, and opportunities to leadership stakeholders.
Data Points & Market Insights
The Incentive Marketing Association represents organizations across a $90 billion incentive industry, underscoring the importance of proving program effectiveness and business value.
The Incentive & Recognition Insights 2025 study gathered input from more than 600 executives worldwide, reflecting growing attention to measurement, business outcomes, and program performance within the incentive industry.
The Incentive Research Foundation notes that one of the greatest challenges in incentive measurement is isolating program impact from other influences such as pricing, marketing activity, and changing market conditions.
Research highlighted by the Incentive Research Foundation indicates that many organizations believe incentive programs positively influence outcomes, yet significantly fewer feel highly confident in their ability to prove that impact through measurement.
Loyalty360 has emphasized that loyalty and incentive programs are increasingly viewed as strategic growth initiatives rather than promotional tactics, making ROI measurement and business justification more important than ever.
Looking Ahead: October's Article
Artificial intelligence is rapidly becoming part of incentive operations, but where does automation create value and where should human oversight remain?
In October, we'll explore AI in Incentive Operations: Finding the Balance, including practical applications for eligibility validation, fraud prevention, optimization, governance, and responsible use of automation. As organizations look toward 2027 planning, understanding how to use AI effectively while maintaining compliance, trust, and program integrity will be critical.
Final Thought: The most effective incentive programs are not necessarily the ones with the biggest budgets or the largest rewards. They are the ones that can clearly demonstrate impact, learn from performance data, and continuously improve. If incentives are strategic investments, ROI measurement is how organizations ensure those investments continue to deliver value year after year.
 About the Author
Paul Flemr is Senior Vice President of Incentive Marketing Solutions at Group O, bringing more than 17 years of leadership experience across operations, customer care, and incentive marketing. Throughout his career at Group O, Paul has held progressive roles spanning Customer Care, Operations, and Executive Leadership, giving him a uniquely end‑to‑end perspective on building and delivering high‑impact incentive programs. Known for his passion for concierge‑level client service, Paul is deeply committed to ensuring incentive marketing clients receive seamless, white‑glove support—from strategy and program design through execution and fulfillment. He is a strong advocate for embracing new technology and innovative ideas to continuously elevate program performance and the client experience. As an author for The 2026 Incentive Strategy Roadmap, Paul brings practical insight, operational expertise, and a forward‑looking mindset to help organizations design incentive programs that drive engagement, loyalty, and measurable results.
